


Runtime Systems and Tools:
Parallel Performance Analysis, Visualization and Optimization
Tools
The Projections Performance Analysis Framework: An Introduction to Projections
The significant gap between peak and realized performance of parallel machines motivates the need for effective performance analysis and tuning of applications running on those machines. To this end, we have developed a framework for performance analysis and visualization called Projections for Charm++.Performance Instrumentation
The Charm++ runtime system provides, to Projections' instrumentation component, the ability to record detailed performance information about events as an application is executed. Examples of these events are the start and end of Charm++ entry methods and message sends. This data is recorded on per-processor log buffers and written as log files at the end of the application. These log files are then used for post-mortem performance analysis through the visualization component of Projections. This instrumentation is provided automatically whenever the application is linked with Projections' tracing modules by the application developer. We also provide various runtime options and APIs to allow the user to flexibly control the intrusiveness, size of data collection as well as the resolution of performance data collected, from full event traces to a summary profile of entry method utilization.
Performance Visualization and Analysis
In its current form, the visualization component of Projections relies on manual analysis by the user. It is implemented in Java and provides support of the analysis through useful application views and abstractions like utilization graphs, histograms and event timelines.
Performance analysis is human-centric. This illustrated below from the figures 1a to 1c: From visual distillations of overall application performance characteristics, the analyst employs a mixture of application domain knowledge and experience with visual cues expressed through Projections in order to identify general areas (e.g. over a set of processors and time intervals) of potential performance problems. The analyst then zooms in for more detail and/or seeks additional perspectives through the aggregation of information across data dimensions (e.g. processors). The same process is repeated, usually with higher levels of detail, as the analyst hones in on a problem or zooms into another area to correlate problems. The richness of information coupled with the tool's ability to provide relevant visual cues contribute greatly to the efficacy of this analysis process.
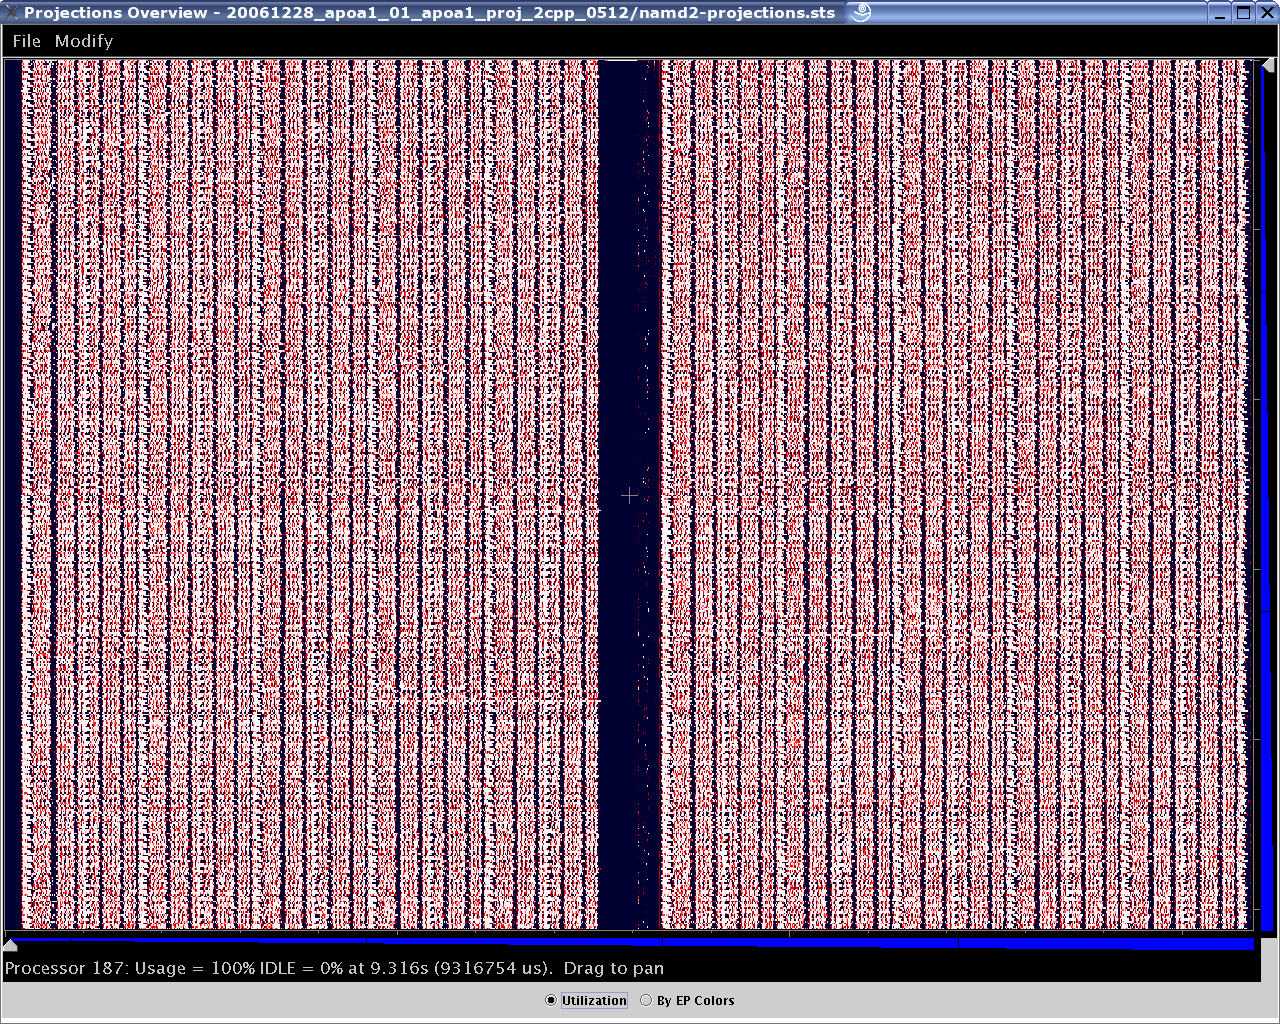
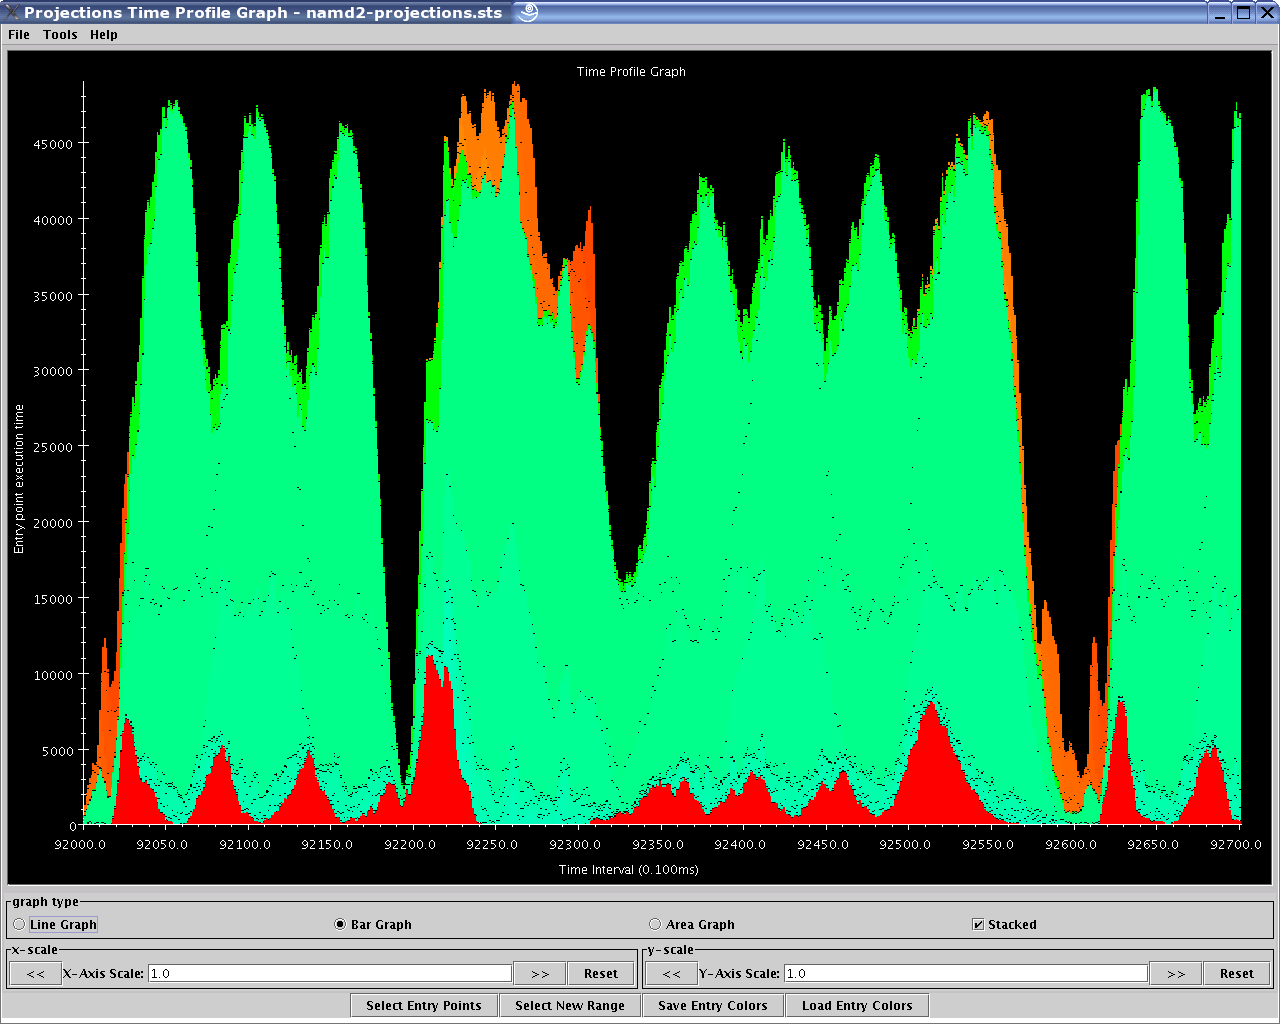
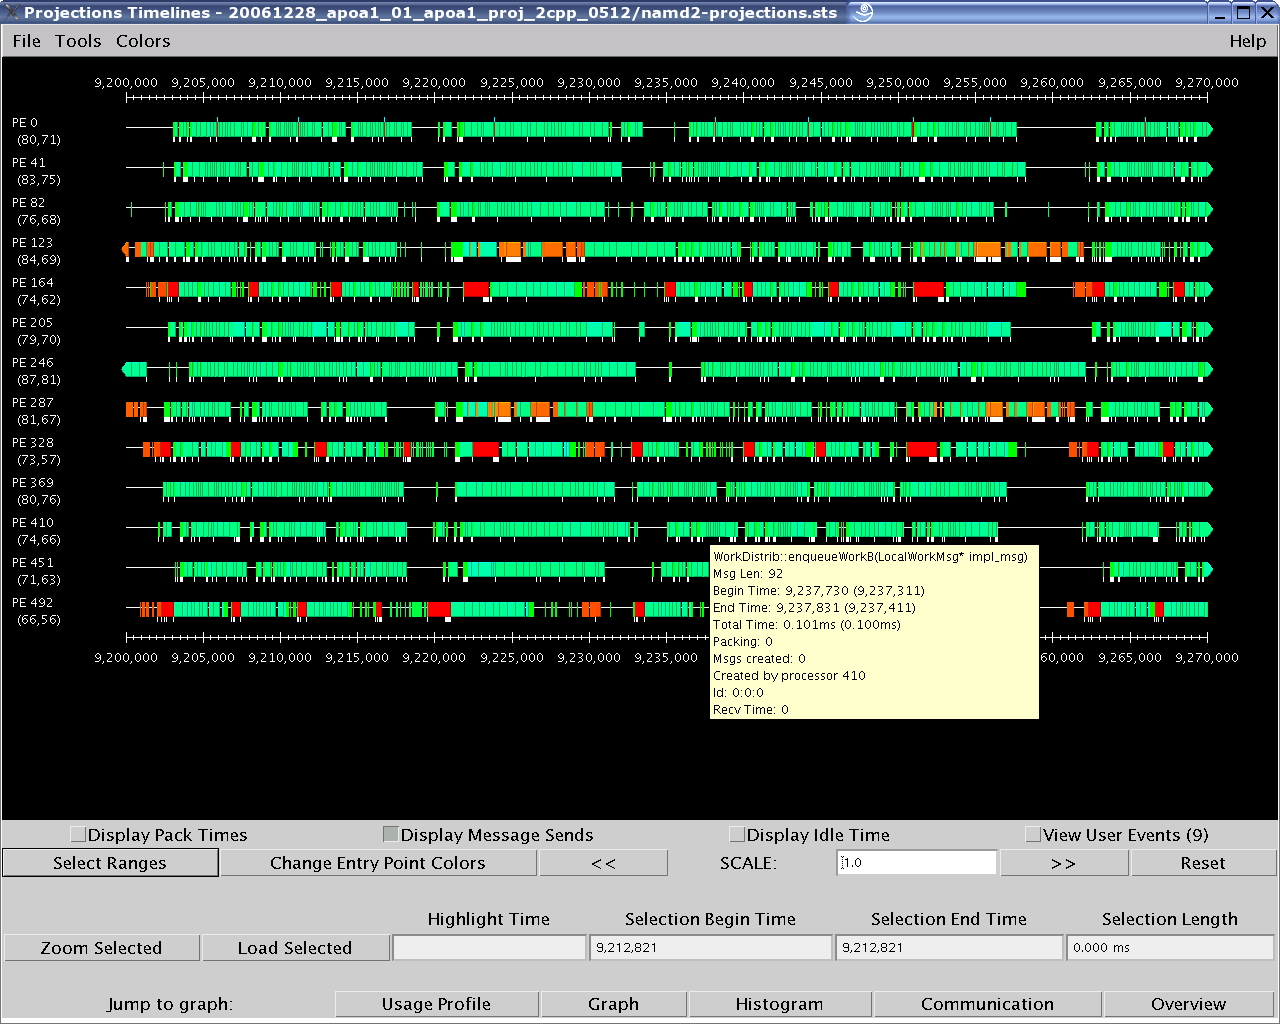 Figure 1a: Overview of 512-processor run of NAMD over several seconds of execution.
Figure 1b: A Time Profile of 512 processors over a 70ms range of interest of the same NAMD simulation.
Figure 1c: Detailed Timeline of events on a user-selected subset processors of the same 70ms range.
Figure 1a: Overview of 512-processor run of NAMD over several seconds of execution.
Figure 1b: A Time Profile of 512 processors over a 70ms range of interest of the same NAMD simulation.
Figure 1c: Detailed Timeline of events on a user-selected subset processors of the same 70ms range.
As shown above, the Overview (Figure 1a) gives the user a general picture of application behavior in terms of utilization across processors and over time. The Time Profile (Figure 1b) provides a breakdown of entry method activity over time, summed across all processors, effectively providing another, more detailed, perspective of the data provided by Overview. The Timeline (Figure 1c) offers the most detailed look into exactly what performance events occurred on each selected processor, allowing the examination of causal effects and other runtime information. Other examples of the views offered include: the Usage Profile (Figure 2); which reveals information about the overall workloads across processors over a specified time range and is particularly useful in identifying Charm++ events that contribute to computational load imbalance in the program.
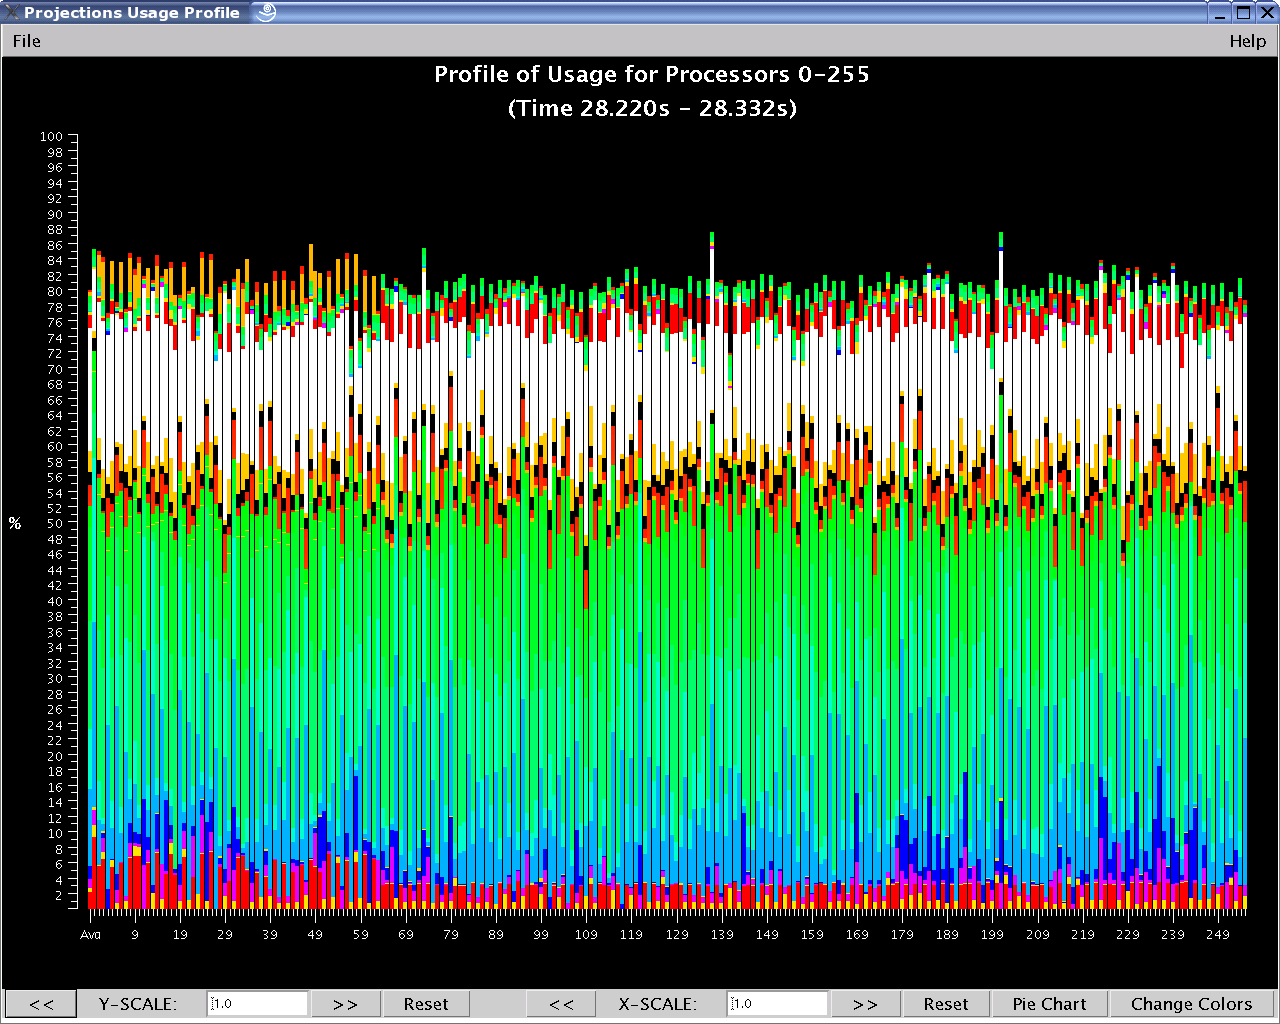 Figure 2: Usage Profile of various Charm++ Events across processors
Figure 2: Usage Profile of various Charm++ Events across processors
Keeping Performance Analysis Effective
Issues and Motivation
In general, the analysis and subsequent tuning of an application is a non-trivial task for the analyst/developer. It is time-consuming and as an application scales to larger numbers of processors, running larger simulations, the problem of locating performance bottlenecks and problems can potentially be intractable. This is due to the growth in the volume of performance data the above-mentioned scaling inevitably produces. The consequences are twofold: the performance tool must read and process much more data, hence taking even more time and reducing responsiveness; and the performance information presented to the analyst visually can quickly become overwhelming. Our current research efforts in performance tools are directed to face these challenges in order to maintain Projections as an effective and useful tool.Automating Performance Problem Discovery
We have been developing ways to help automate the discovery of performance bottleneck for analysts and quickly presenting this information visually via the Projections visualization tool.
One of these ways is through our NoiseMiner tool where we automatically locate precise sections of the performance space where unusually long (in regards to the rest of application activity) time durations are spent (Figure 3). Such long events may be symptoms of operating system interference, software interference, or computational noise. The analyst may then browse these sections of performance space in mini-timelines (Figure 4).
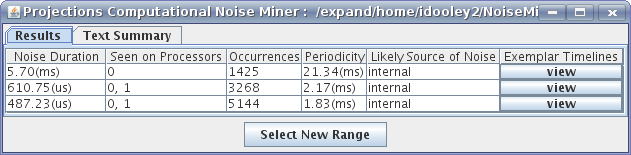 Figure 3: NoiseMiner lists groups of events with similar duration stretches. Each group is likely affected by the same type of operating system interference, software interference, or computational noise.
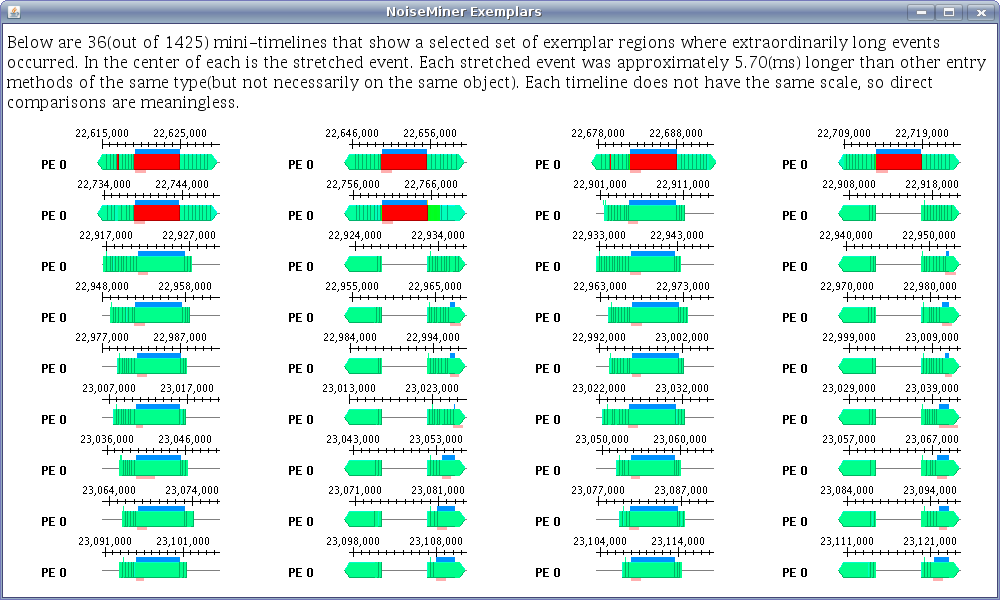 Figure 4: 36 mini-timelines can be viewed for each noise component detected by NoiseMiner. In the middle of each timeline is an event whose duration is longer than expected.
Performance Tool Scalability
As applications scale to handling larger datasets to be run on larger processor counts, the volume of performance data grows significantly. As such, for performance tools to remain effective and relevant, the scalability of the performance analysis process has to be addressed. Currently, we are pursuing research and development in the following directions of scalability:
- Performance Tool Scalability - the tool itself must be capable of handling a large volume of data gracefully and responsively.
- Data Scalability - we are researching ways by which performance data may be reduced without losing too much performance bottleneck information so that tools may continue to work effectively. One such method involves using Clustering techniques and heuristics to select only a subset of processor logs to retain at trace generation time.
- Visualization Scalability - This is related to the above-mentioned research on automation. We are developing various ways and means by which pertinent performance information gets quickly presented to the analyst. In the face of greater volume of performance data, and more importantly, a larger performance-space as a result of scaling, naively extending the processing and display capabilities (i.e. handling more data, displaying timelines for more processors) of performance tools without better visual aids to the analyst simply overwhelms the analyst with too much information.
- Turn-around Time - to gather performance traces in order to study the effects of extreme scaling traditionally requires submitting large job requests that can take an extremely long time waiting in the job submission queue of most supercomputing centers. This is in spite of the fact that, for performance analysis purposes, the instrumented application only needs to execute for a few seconds to an hour. Since the performance tuning cycle generally requires several rounds of hypothesis testing and code correction, the turn-around time of having these large-scale jobs wait in the queue can be highly significant. We are currently developing a way of using our BigSim Charm++ application simulation package to generate different performance traces under different conditions like Charm++ object-to-processor placement, load balancing schemes, network topology and other machine characteristics. This will potentially allow us a way to test performance hypothesis by re-simulation on a smaller number of processors instead of having to modify application code or parameters and then submitting them for a large-scale run.
People
Papers/Talks
20-02
2020
[Paper]
[Paper]
End-to-end Performance Modeling of Distributed GPU Applications [ICS 2020]
19-06
2019
[Poster]
[Poster]
ACM SRC: Fast Profiling-based Performance Modeling of Distributed GPU Applications [SC 2019]
17-07
2017
[Paper]
[Paper]
Visualizing, measuring, and tuning Adaptive MPI parameters [VPA 2017]
17-04
2017
[Paper]
[Paper]
A Memory Heterogeneity-Aware Runtime System for Bandwidth-Sensitive HPC Applications [IPDRM 2017]
15-19
2015
[Paper]
[Paper]
Recovering Logical Structure from Charm++ Event Traces [SC 2015]
13-44
2013
[Paper]
[Paper]
Parallel Science and Engineering Applications: The Charm++ Approach: Chapter 3: Tools for Debugging and Performance Analysis [Book 2013]
13-40
2013
[Paper]
[Paper]
Parallel Science and Engineering Applications: The Charm++ Approach: Chapter 7: Remote Visualization of Cosmological Data using Salsa [Book 2013]
13-04
2013
[Paper]
[Paper]
Steal Tree: Low-Overhead Tracing of Work Stealing Schedulers [PLDI 2013]
11-27
2011
[Paper]
[Paper]
Optimizations for Message Driven Applications on Multicore Architectures [HiPC 2011]
11-14
2011
[Poster]
[Poster]
Molecular Dynamics Simulations on Supercomputers Performing 10^18 flop/s [UIUC Postdoc Symposium 2011]
10-03
2010
[Paper]
[Paper]
Understanding Application Performance via Micro-Benchmarks on Three Large Supercomputers: Intrepid, Ranger and Jaguar [IJHPCA 2010]
09-15
2009
[Poster]
[Poster]
Performance Comparison of Intrepid, Jaguar and Ranger using Scientific Applications [SC 2009]
09-13
2009
[PhD Thesis]
[PhD Thesis]
Techniques in Scalable and Effective Parallel Performance Analysis [Thesis 2009]
09-08
2009
[Paper]
[Paper]
Continuous Performance Monitoring for Large-Scale Parallel Applications [HiPC 2009]
09-05
2009
[Paper]
[Paper]
Integrated Performance Views in Charm ++: Projections Meets TAU [ICPP 2009]
08-05
2008
[Paper]
[Paper]
Towards Scalable Performance Analysis and Visualization through Data Reduction [HIPS 2008]
08-04
2008
[Paper]
[Paper]
NoiseMiner: An Algorithm for Scalable Automatic Computational Noise and Software Interference Detection [HIPS 2008]
07-06
2007
[Paper]
[Paper]
Scalable Techniques for Performance Analysis [CS Res. & Tech. Report 2007]
04-05
2004
[Paper]
[Paper]
Scaling Applications to Massively Parallel Machines Using Projections Performance Analysis Tool [FGCS 2004]
04-02
2004
[Paper]
[Paper]
Performance Modeling and Programming Environments for Petaflops Computers and the Blue Gene Machine [NSFNGS 2004]
03-03
2003
[Paper]
[Paper]
Scaling Molecular Dynamics to 3000 Processors with Projections: A Performance Analysis Case Study [Workshop on Terascale Performance Analysis at ICCS 2003]
99-05
1999
[Paper]
[Paper]
Web-based Interaction and Monitoring for Parallel Programs (ViaConspector) [PPL Technical Report 1999]
99-01
2000
[Paper]
[Paper]
Application Performance of a Linux Cluster using Converse [RTSPP 2000]
96-13
1996
[PhD Thesis]
[PhD Thesis]
Automating Runtime Optimizations for Parallel Object-Oriented Programming [Thesis 1996]
96-12
1996
[Paper]
[Paper]
Towards Automatic Peformance Analysis [ICPP 1996]
96-08
1996
[Paper]
[Paper]
Automating Parallel Runtime Optimizations Using Post-Mortem Analysis [ICS 1996]
96-07
1996
[Paper]
[Paper]
Automating Runtime Optimizations for Load Balancing in Irregular Problems [CPDPTA 1996]
94-01
1994
[Paper]
[Paper]
A Framework for Intelligent Performance Feedback [PPL Technical Report 1994]
92-03
1992
[Paper]
[Paper]
Projections: a Preliminary Performance Tool for Charm [Parallel Systems Fair 1992]